📊 Environmental Statistics

What did we covere
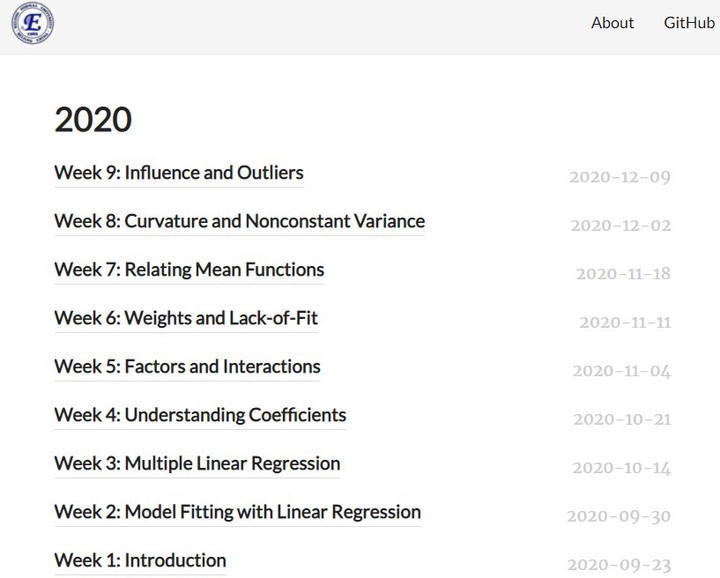
- Fundamental Linear models.
- Statistical concepts and how to apply them in practice.
- Gain experience with R, including data visualization with ggplot2 and Plotly and data wrangling with Dplyr.
Program overview
This site was built to provide additional information and content to the lecture slides of the course Environmental Statistics at Beijing Normal University. Similarly, lecture plots were converted into R with the code used for the graphs included in the posts. It is a page created for you to be familiar with R-Studio and very important packages that will help you during your studies and career. All the information in the articles followed the lecture topics of Professor Yingxia Li. The information, figures, and models were added to the page by Roberto Supe .
Meet your instructor
FAQs
Are there prerequisites?
There are no prerequisites for the first course.
How often do the courses run?
Continuously, at your own pace.